


During our time in the Microsoft Accelerator, Data Science, and Machine Learning cohort, we interviewed a few folks working in integrity management for pipeline operators to ask them to describe some of their most difficult challenges. We anticipated it would range from dealing with silos of data to spatially integrating risk data. However, we were surprised to learn that they simply wanted a solution that would accurately align features (welds, anomalies, valves, etc.) across inline inspection tally sheets.
Huh? After all these years of running PIGS and getting varying tally sheets, this was the most pressing problem?
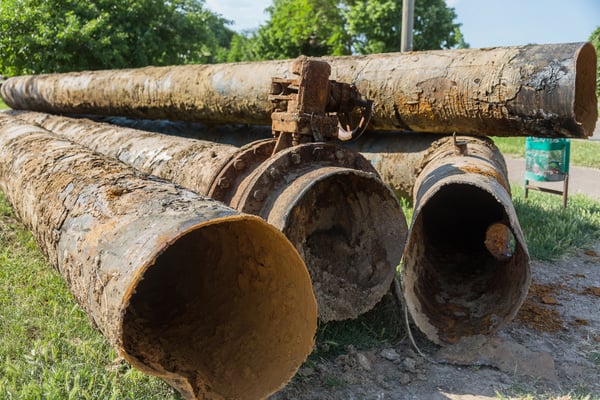
So, being a software start-up following a Lean Startup model, we got to work and started to gather these tally sheets, thousands of them. It immediately became obvious why this was a foundational problem.
Yet, as we continued to dig further there were a couple of scenarios that puzzled us.
- First, it wasn’t uncommon to find that ILI comparison was mostly done by comparing the previous tool run with the most current one. For us, trying to apply data science to the problem, this was completely counter to everything we knew. Pipeline operators have been running PIGS on their pipe segments for decades. As data scientists, we want to look at every data point that has “ever” been collected from these PIGS over the years. It’s foundational to building a true state of the pipeline system that allows for the most statistically accurate and insightful observations of threats to the system
- Second with all the software and algorithms available today, Excel was the only tool available to most engineers (and the best only by default). Engineers doing this work are Excel geniuses. No really, they could give our CFO some lessons and he’s a wizard in Excel. By far, this was the most common scenario, either when the task was outsourced to a 3rd party service provider or attempted in-house. The process goes something like this:
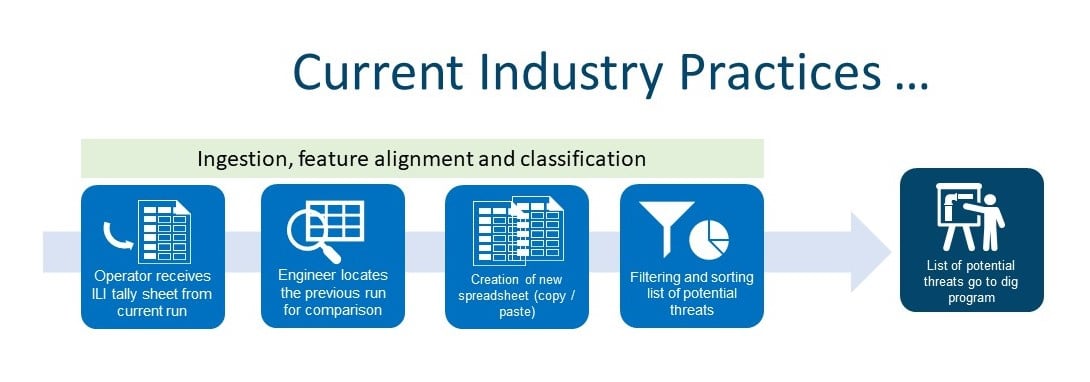
Current Process Flow
- Once an operator receives the ILI tally sheet from the current run, they locate the previous run
- The engineer creates a new spreadsheet, lots of copy/paste from previous/current datasets into this spreadsheet
- Add tabs/rows/columns, soon turning this Excel workbook into a complex 20-tab file with each subsequent file being just as complex
- After filtering, sorting, and cutting/pasting, a list of potential threats goes into the Dig Program
Of course, the spectrum across pipeline operators varies from extensive Excel macros (we saw lots of buttons in Excel) to more sophisticated programs. However, in all the cases there are a few workflows that remain consistent.
- Due to the volume of data, operators typically filter to only include features based on certain parameters. i.e. only look at anomalies with a current depth > 25%. Unfortunately, on average, this limits the insights to roughly 4-7% of total ILI data for any given segment. By using more advanced data analysis techniques and algorithms, we can extract information from the whole file
- Almost all analysis is done manually through extensive Excel manipulation resulting in an Excel worksheet likely touched by multiple individuals and ultimately stored on a network drive somewhere. We seldom ran into statistical models to support this process and there was no resemblance to a “state” for the pipeline.
We became convinced that this was indeed a perfect Data Science problem. These are the areas we have tackled and continue to evolve.
- Bulk ingestion – to effectively apply data science to ILI data we need lots of it. That’s why we developed an ingestion algorithm that can take Excel files with tally sheet data and ingest it in bulk. We have enough data to have built a good classifier with high confidence over 30,000 miles of pipe across 20+ years of assessments. As we onboard new customers we re-train the classifier and can quickly ingest the customer’s entire history of ILI data.
- Feature classification – this is one of the more important components of our ingestion algorithm as it provides the structure for all algorithms that follow. It normalizes features according to best practices which essentially provide the backbone for regulatory compliance. For example, we use “text analytics” to look for patterns across the entire ILI tally sheet data to determine if a feature has been characterized and included in the classification.
- All features – we also classify all the features within the ILI data set. This is mandatory for finding interacting threats, an advanced algorithm possible only through data science.
- Alignment – data science techniques give us the capability to perform multiple passes of the data to identify the specific patterns that impact both linear (wheel count) and orientation (roll) offsets as the PIG goes down the pipe. It does this at scale, not only across the segment, but within any section. This is what allows us to produce high confidence, box call out over box call out with one-to-many and many-to-one results, across the entire “state” of the segment (show multiple year alignment).
- Truth data – this is the crux of alignment. How do we know it’s correct? Of course, the best way is to use customer “truth” data, sometimes referred to as correlation data. However, when we can get it, we have not been able to place high confidence in its accuracy. This then leads us to NDE data. Our data science team has used this data to statistically observe how it impacts “depth uncertainty”. While NDE data is applicable to some segments in increasing the overall confidence, so far, it has proven to be outside of acceptable confidence ranges to be relevant. This work will continue. Finally, as with all true verification within the pipeline industry, excavations provide the ultimate truth. We continue to use data science methods to constantly learn, train, and act based on what the data is telling us.
Ultimately, as a pipeline operator, imagine opening your browser and dropping the latest ILI tally sheet into a solution and have it normalized automatically into an industry standard Alias classification structure. After which, an Alignment algorithm aligns 100% of the features against the existing state while at the same time adjusting the current state to include this latest ILI data. In the data science world, this is the only way to “understand and analyze actual phenomena”. We can now get statistically accurate results with high confidence scoring that allows for pattern and interacting threat detection, within minutes, with everything packaged, ready to go for regulatory compliance reporting.